Gcore collects and stores metrics and logs from various cloud resources, including load balancers. This guide explains the different monitoring features and how to configure them for an existing load balancer.Documentation Index
Fetch the complete documentation index at: https://gcore.com/docs/llms.txt
Use this file to discover all available pages before exploring further.
Prometheus listener
Load balancers use listeners to associate a port with a pool of instances. In addition to the regular balancing listeners, you can create one that exposes an endpoint with the balancer’s metrics. This enables you to scrape them with Prometheus and view them with Grafana.Enable Prometheus listener
You can enable the Prometheus listener from the Customer Portal by following these steps:Open the listener settings
To enable the metrics endpoint, open the Gcore Customer Portal, navigate to Cloud > Networking > Load Balancers, and click the name of a load balancer in the list.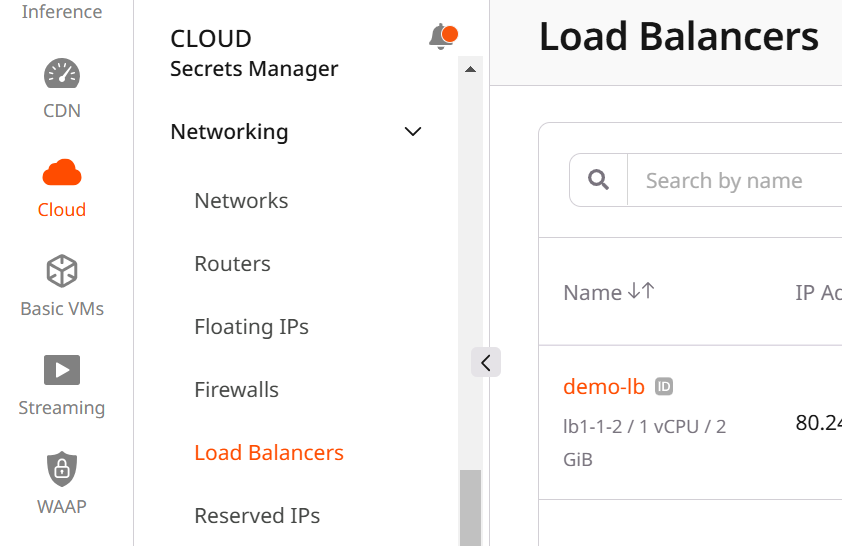
Initialize the listener creation
Select the Listeners tab, scroll down until you see the Add Listener button, and click it.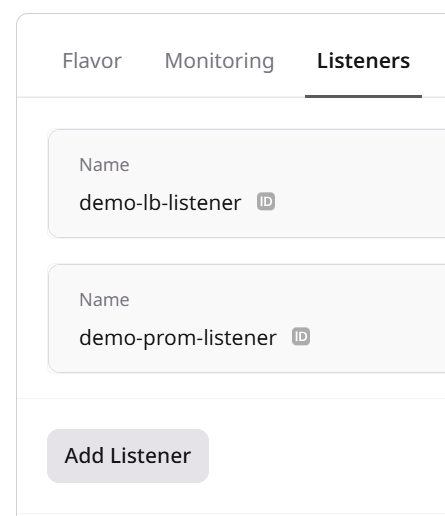
Configure the listener
Enter a Name for your listener, set a Port and a Connection limit, and for the Protocol select Prometheus.Just like with regular listeners, you have the following options to secure your Prometheus listener: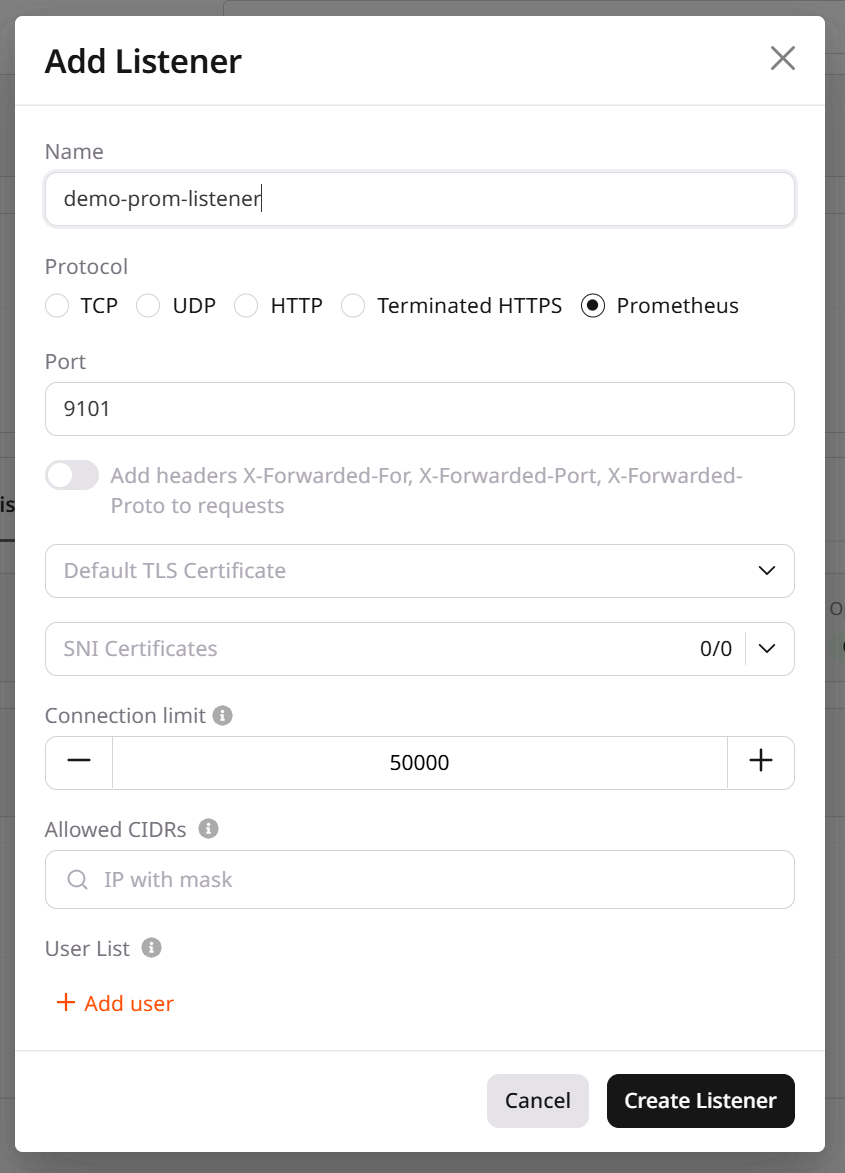
- Define an allowed IP range with CIDRs.
- Define a list of users who get access through Basic Auth.
- Enable SSL/TLS by adding certificates.
- Enable mTLS via the Gcore Cloud API.
Disable Prometheus listener
Before you delete a Prometheus listener, you should delete the corresponding job from all prometheus.yml files.
Open the load balancer settings
Open the Gcore Customer Portal, navigate to Cloud > Networking > Load Balancers, and click a load balancer’s name in the list.
Logging as a service
Gcore offers Managed Logging, also known as logging as a service (LaaS) for all cloud resources.When you enable logging on a load balancer, LaaS will store the logs in the same region as the load balancer.
Enable logging
You can enable logging via the Customer Portal by following these steps:Open the load balancer settings
To enable the logging, open the Gcore Customer Portal, navigate to Cloud > Networking > Load Balancers, and click the name of a load balancer in the list.
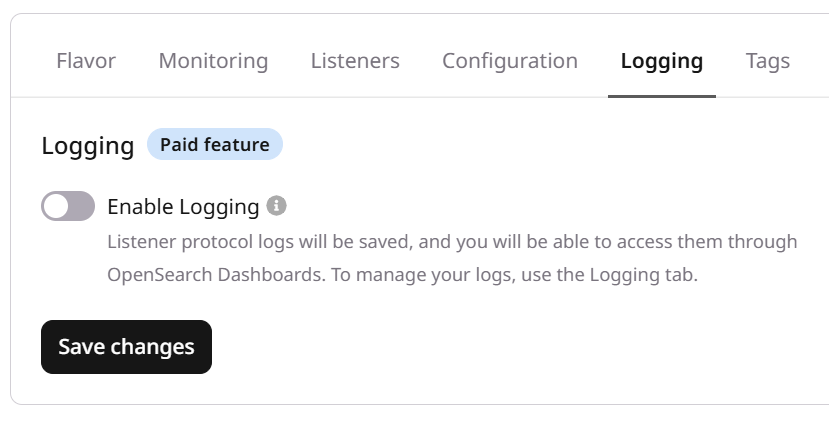
Initialize logging
Select the Logging tab, and activate the Enable Logging toggle.You can either use an existing log Topic or create a new one, allowing you to define a Retention period.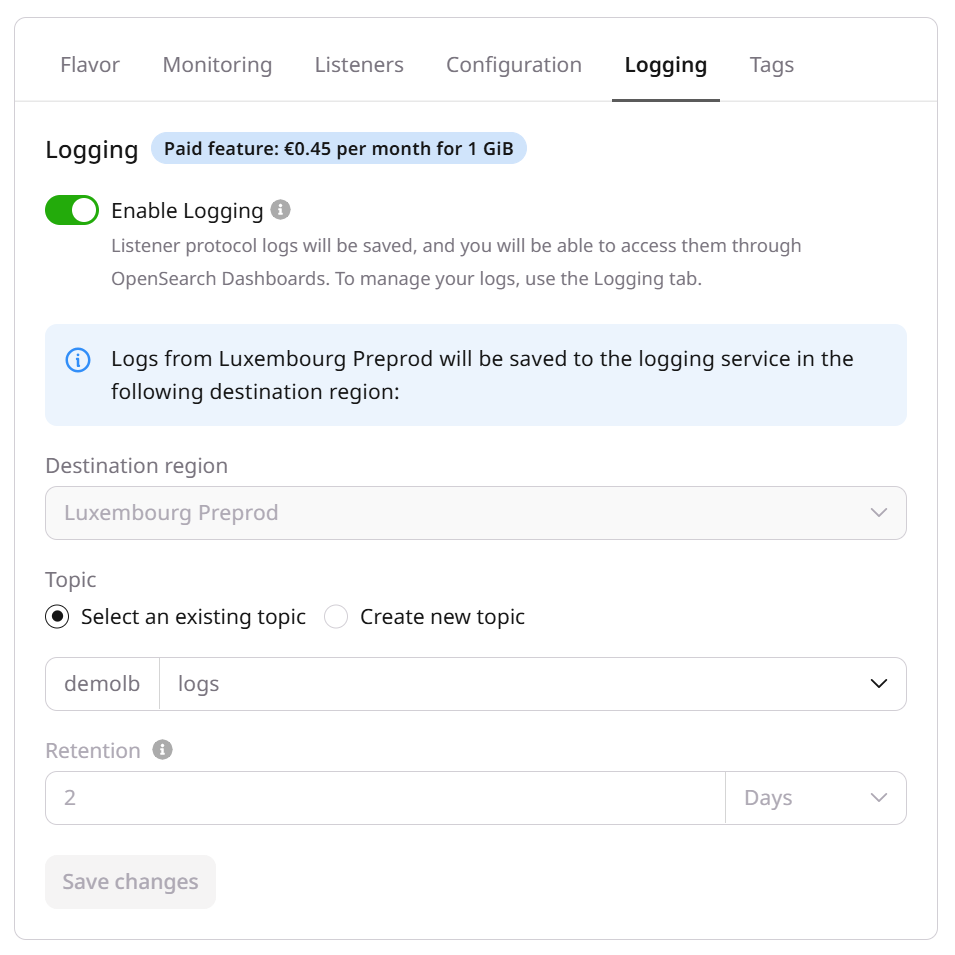
View the logs
You can now view your logs in the Customer Portal or your own Grafana instance. To view the logs in the Customer Portal, follow these steps: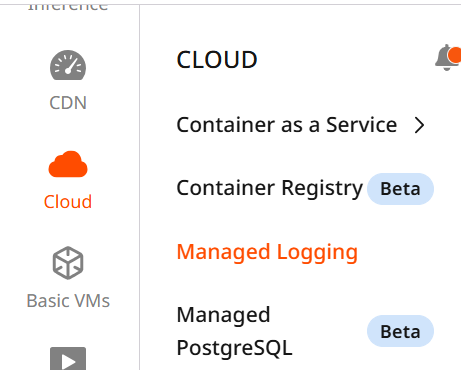
Disable logging
You can disable logging via the Customer Portal by following these steps:Open the load balancer settings
Open the Gcore Customer Portal, navigate to Cloud > Networking > Load Balancers, and click a load balancer’s name in the list.
Cloud API endpoints
You can request status, metrics, and general statistics for your load balancers via the Gcore Cloud API.Load balancer status
The status endpoints provide details about a load balancer’s operating and provisioning status, its listeners, and their pools.
Load balancer metrics
The metrics endpoint provides information about CPU, memory, and network utilization.
Load balancer and listener statistics
The get endpoints for load balancers and listeners provide data about connections, traffic, and errors when called with?show_stats=true.

